How many enbies are there?
2022-04-28 | @andrea
We're being asked quite often, especially when talking to members of the academia, if we have any estimates regarding the number of nonbinary people (either in general, or in Poland in particular). Until now, the best numbers we could give them were describing the number of enbies who decided to create a card on our page or respond to our census (Polish), etc.
Until now. Behold!
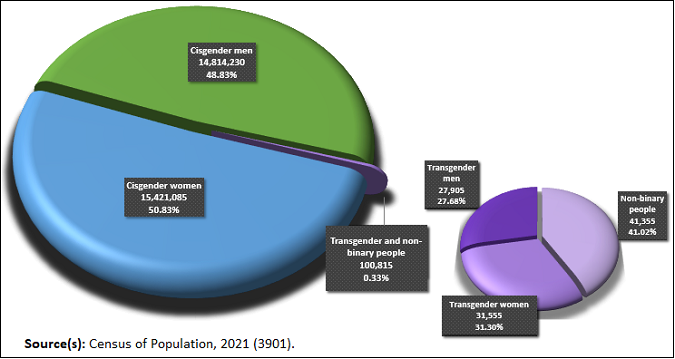
Canada is the first country to provide census data on transgender and non-binary people.
This week Statistics Canada published a report in which they analyse the results of their census in terms of gender diversity. And a TL;DR version is basically this:
- 0.33% of responders were not cis;
- 0.13% of responders were not binary;
- the younger the age group, the more trans and nonbinary people were in it;
- most enbies lived in the largest urban centres.
Which is all hardly any surprise – but it's amazing to finally see some concrete numbers to confirm our veeeery rough estimates!
However… we can't just take those numbers at face value. The correlation between being nonbinary and things like age or place of residence suggests that it's one of those things the true extent of which we can only measure once they become normalised, once the society gets liberated from the chains of cisnormativity.
As an analogy, take a look at this graph of left-handedness over time:
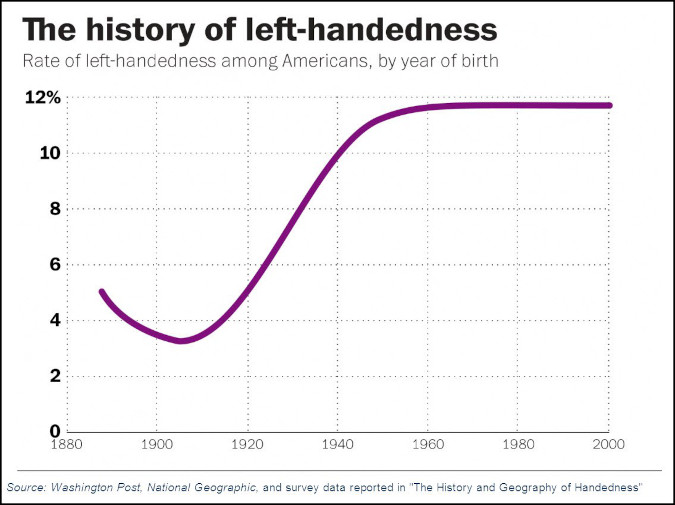
It's not like people got spoofed by some evil left-handist propaganda and suddenly started using their hands against their nature. Quite the opposite – around the beginning of the 20th century the society finally stopped trying to force kids to suppress their left-handedness, and it just gradually became a non-issue until it became clear that the number of naturally left-handed people is around 12%.
We see a similar shift now when it comes to trans issues. Younger generations, as well as residents of big cities, tend to be more accepting of queerness, which makes it easier to come out or even question your gender in the first place. That's why I believe that there is actually way more trans people in the population than 0.33%. The more accepting we become as a society, the more people will feel free to question, explore, discover and disclose their gender identity.
For the same reason we can't just extrapolate Canadian numbers onto the entirety of the human population. With such big differences within Canada, it would be unreasonable to assume the differences between countries aren't just as big.
But, considering the history of left-handedness, divorce rates, same-sex marriage etc., what makes sense to me is making an assertion that the real number of trans and nonbinary people in a post-transphobia society would be at least as high as the highest currently available metric, if not higher. Among Canadian 20-24-year-olds 0.85% are not cis and 0.43% are nonbinary. Since we're at the beginning of the “left-handedness curve” and at this point the real number is anyone's guess, I think it's fair for me to just round it up and say:
There are reasons to believe that at least 1% of the population is transgender, and at least 0.5% of the population is nonbinary.
Putting that in terms of the population of Poland, for those who had asked us before, it's about 377 thousand trans people and about 188 thousand nonbinary people. And even if you took the lower ends of the estimates – there's still quite many of us 😉
React:
Share:


